
Advancing Drug Discovery Through AI-Powered Solutions
Eidogen-Sertanty is dedicated to improving healthspan, medicine, and general well-being through cutting-edge pharmaceutical research tools.
LEARN MORE
Our Offerings

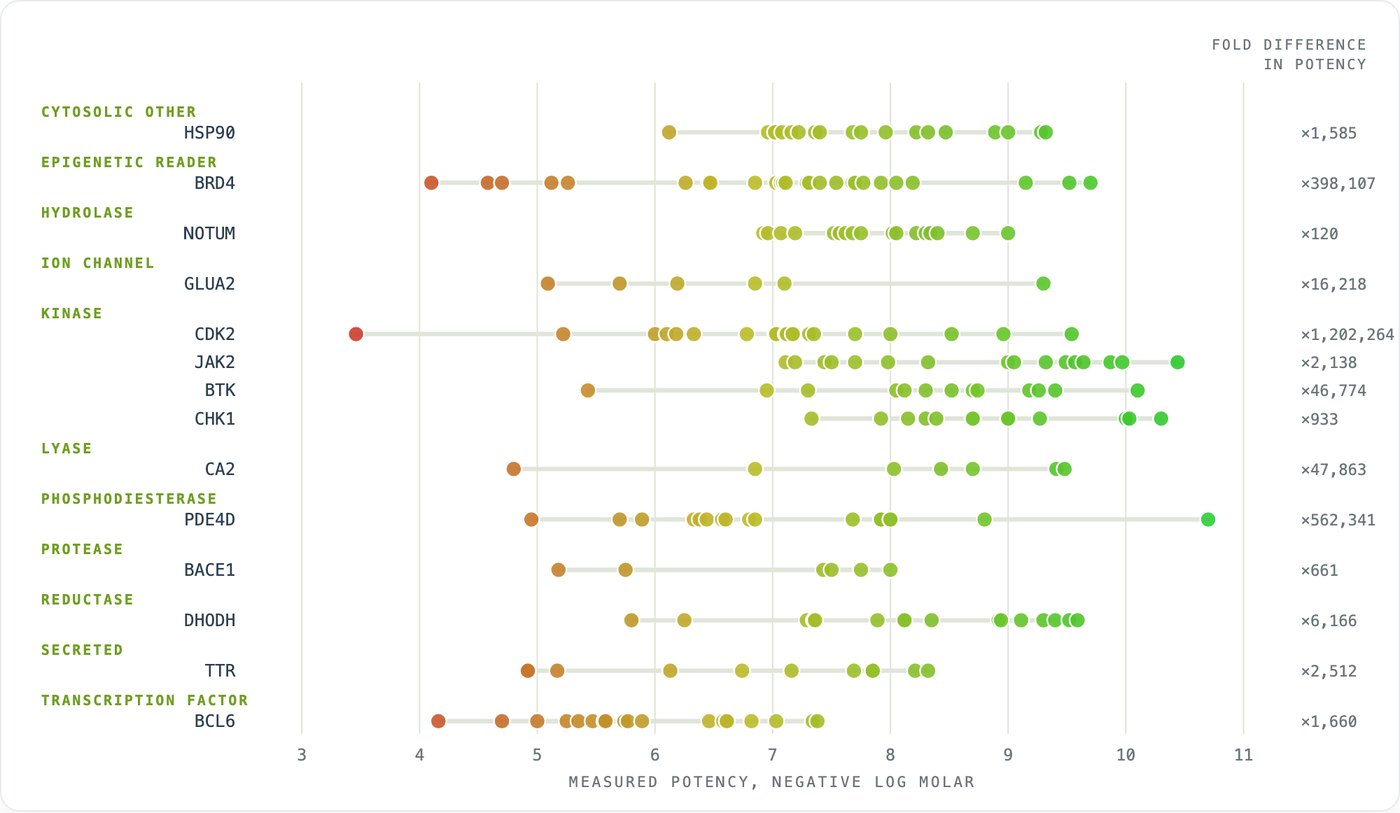
Compound preference (left) and target preference (right), across 34 protein families. Click the diagrams to visit familyfoundationmodel.com
Family Foundation ModelNew!
The broad instrument. Two separately fitted models over one roster that spans 34 protein families. Give the first a target and a set of compounds and it ranks which compound that target prefers, the question you ask of a hit list. Give the second a compound and targets from different families and it ranks which target the compound prefers, the off-target and repurposing question. The GPCR and kinase models below are family deep dives beside it: each takes one family and goes deeper, on data assembled for that family.
Trained on ChEMBL 37 alone, so both sets of weights are freely downloadable. The compound-preference model scores 0.71 on 65,725 held-out comparisons over 2,079 targets; the target-preference model scores 0.75 on 8,689 held-out comparisons between two families and 0.78 on 32,738 within one family, over 2,279 targets.
Explore the Family Foundation Model →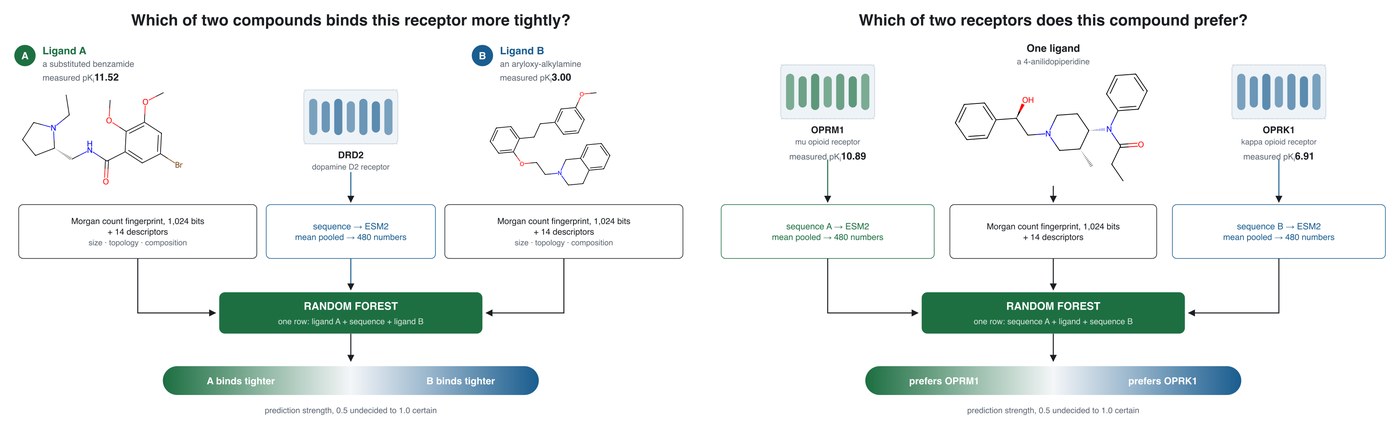
Potency ranking (left) and selectivity (right), over G protein-coupled receptors. Click the diagrams to visit gpcrfoundationmodel.com
GPCR Foundation ModelNew!
The same two questions, asked of G protein-coupled receptors. Give the first model a target sequence and two compounds and it says which is more potent. Give the second one compound and two targets and it says which target the compound prefers. Both read the target’s amino-acid sequence, with no structure, no docking and no binding-site definition, and both are built on ChEMBL together with Eidogen-curated GPCR data. This is a deep dive into one family rather than a model that spans many.
Tested on measurements the models never saw: 0.77 over 762,493 held-out potency comparisons across 235 targets, and 0.80 over 24,741 selectivity comparisons across 211. Acting only on the confident calls, at prediction strength 0.70 and above, raises those to 0.94 and 0.93. Every one of those targets carries its own measured accuracy, and the site publishes all of them.
Explore the GPCR Foundation Model →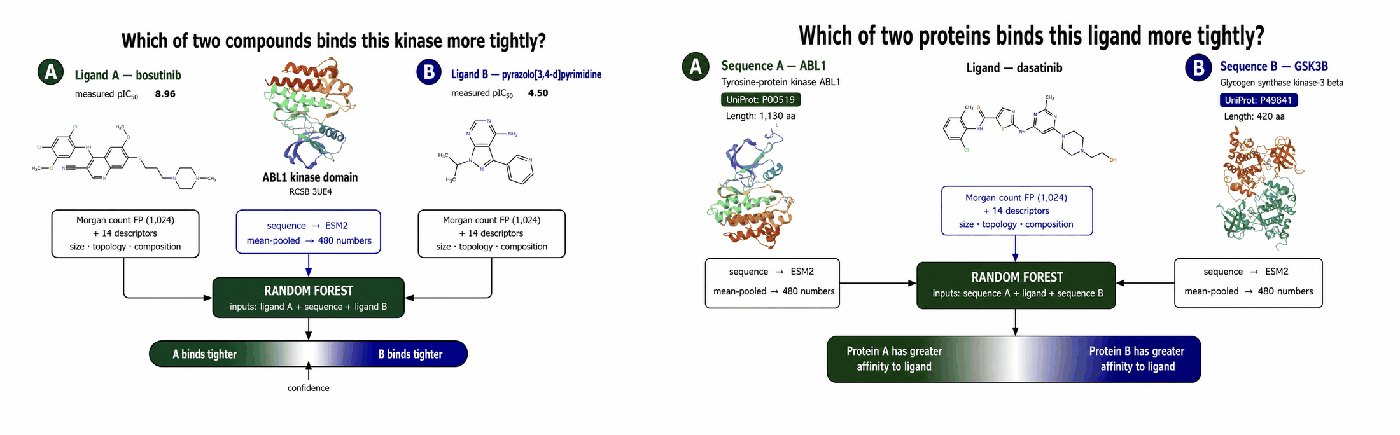
Version 2: potency ranking (left) and selectivity (right). Click the diagrams to visit kinasefoundationmodel.com
Kinase Foundation ModelNew!
Two models, one question each. Give the first a kinase sequence and two compounds and it says which is more potent. Give the second one compound and two kinases and it says which kinase the compound prefers, the selectivity question. Both read the kinase’s amino-acid sequence itself, with no structure, no docking and no binding-site definition, and both take their primary measurements from the Kinase Knowledgebase, with ChEMBL used to cross-validate rather than to train. This is the other deep dive into a single family.
Tested on ChEMBL measurements the models never saw: 0.69 over 1,836,100 held-out potency comparisons across 477 targets, and 0.75 over 3,137,588 selectivity comparisons. Acting only on the confident calls, at prediction strength 0.70 and above, raises those to 0.88 and 0.92. Version 1, the original scorer across 478 kinases, remains published alongside them.
Explore the Kinase Foundation Model →
The search cycle, the variable-length descriptor sets it evolves, and what 250 repetitions produce. Click the figure for the full method
cHIA: Human Intestinal Absorption ModelNew work
In 1998 we published a model that predicted percent human intestinal absorption for 86 compounds from six molecular descriptors and a small neural network. That result rested on one division of the compounds into training, cross-validation and prediction groups. Repeating that division 250 times shows how fortunate it was: 236 of 250 draws are worse than the published cross-validation error, 249 are worse than the published external error, and none matches both.
The descriptors themselves held up. Given a modern learner on nine times the data, they still reach a correlation of 0.63, and the properties they measured, charge, polar surface and hydrogen bond donors, are exactly what a free search over 1,301 descriptors selects today. The deployed absorption model uses 25 consensus descriptors and a random forest fitted on 780 compounds, and is right about whether a compound clears 30 percent absorption 92.60 percent of the time.
The same procedure carries to cyclic peptides, with a model for permeability across an artificial membrane fitted on 7,298 peptides.
How the method works →
Percent measured active against protein families reached (top), and the proteins whose solved ligands most resemble the CYP3A4 inhibitors (bottom). Click the figure for the full method
ToxPredNew
Twenty-three years ago, in 2003, we published a method that predicts what a compound will do by asking the measured compounds that resemble it. A consortium of structural neighbors votes, and the vote is the answer. The data it ran on then was proprietary. That same data is public now and far larger, so the method has been rebuilt on the public record and revalidated against measurements it never saw.
It lands within one log unit of the measured rat oral LD50 92.1 percent of the time, on the 1,336 of 1,994 held-out compounds that carry an exact value, against 94 percent reported in 2003. Applied unchanged to 28 further endpoints. Growing the voting reference set from 127 to 5,953 compounds moves the share it answers for from 3.3 to 46.5 percent, while accuracy rises from 85.4 to 90.9 percent by 610 compounds and then holds near 92 percent.
A second signal reads cross-family reach, measured across the 27,910 ligands Reverse Screen indexed on 20 September 2026: a compound whose structural matches reach no protein family inhibits CYP3A4 2.5 percent of the time, and one reaching sixteen families or more inhibits it 51.2 percent of the time. It is computed from ligand similarity, so it needs no protein structure for the query and no docked pose.
When no reference compound is similar enough, the method declines rather than guessing, which is why every accuracy figure here carries the coverage it was measured on.
How the method works →Every co-crystal ligand in the Protein Data Bank, embedded by pharmacophore fingerprint. Drag to rotate.
Reverse ScreenNew
Forward screening asks which of many ligands bind one target. Reverse Screen asks the opposite: given a molecule, which proteins might it interact with. That is the question that arises once a compound exists, and the only question available for a molecule a generative method proposes, because a designed structure has no measured target at all.
Docking one molecule into every characterized site answers it directly and takes 40.5 hours. Instead, every co-crystal ligand in the Protein Data Bank is indexed by the three-dimensional pharmacophore fingerprint it presents, predicted from two-dimensional structure by PharmCast, together with the UniProt accessions it was solved against. A query is fingerprinted in 4 milliseconds and compared against all 28,043 indexed ligands in 40 milliseconds, and the proteins its nearest neighbors were crystallized against come back as the candidate pool. AutoDock Vina then docks only into those.
Across 3,000 held-out molecules, pooling the five most similar indexed ligands gives 21.1 candidate proteins and contains the molecule's own known target 48.8 percent of the time. Pooling twenty-five gives 104.5 proteins and 60.8 percent.
A worked example. Screening orforglipron returns matrix metalloproteinase 9 at rank 5 of 48, through the deposited ligand E40 in 4WZV at a pharmacophore similarity of 0.803. The two molecules share no scaffold, which is the point: the fingerprint compares the features a molecule presents in three dimensions rather than the way it is drawn. Docking into that site gives a top pose at −12.1 kcal/mol, and all eight poses land in the same groove the deposited ligand occupies.
See the eight poses in three dimensions →
Try Reverse Screen →
One ligand, one site, every contact measured from the deposited coordinates.
Contact AtlasNew
Reverse Screen ranks the proteins a molecule might bind. Contact Atlas searches the co-crystal ligands themselves. Draw a structure and get every ligand in the Protein Data Bank that contains it, matches it exactly, or resembles it by pharmacophore, then read what each one actually does in the site it was solved in.
A substructure search is an exhaustive graph match over the whole index, never a sample and never truncated. An exact search matches on the connectivity layer, so a stereoisomer of the query still finds it. A pharmacophore search uses the same predicted fingerprint Reverse Screen ranks with, which is what lets a scaffold hop score at all. You can also search by name: the drug name, a trade name, a research code or a ChEMBL identifier.
Every hit opens on its contact map, a flat drawing of the ligand as deposited, ringed by the residues it touches, with the hydrogen bonds, salt bridges, pi stacking and cation to pi interactions measured from the coordinates rather than predicted, and the potency ChEMBL records against that target. A molecule deposited ten times can be read in each of its sites.
Explore the Contact Atlas →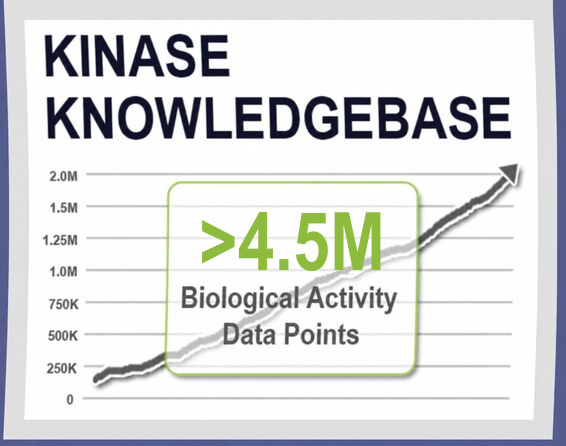
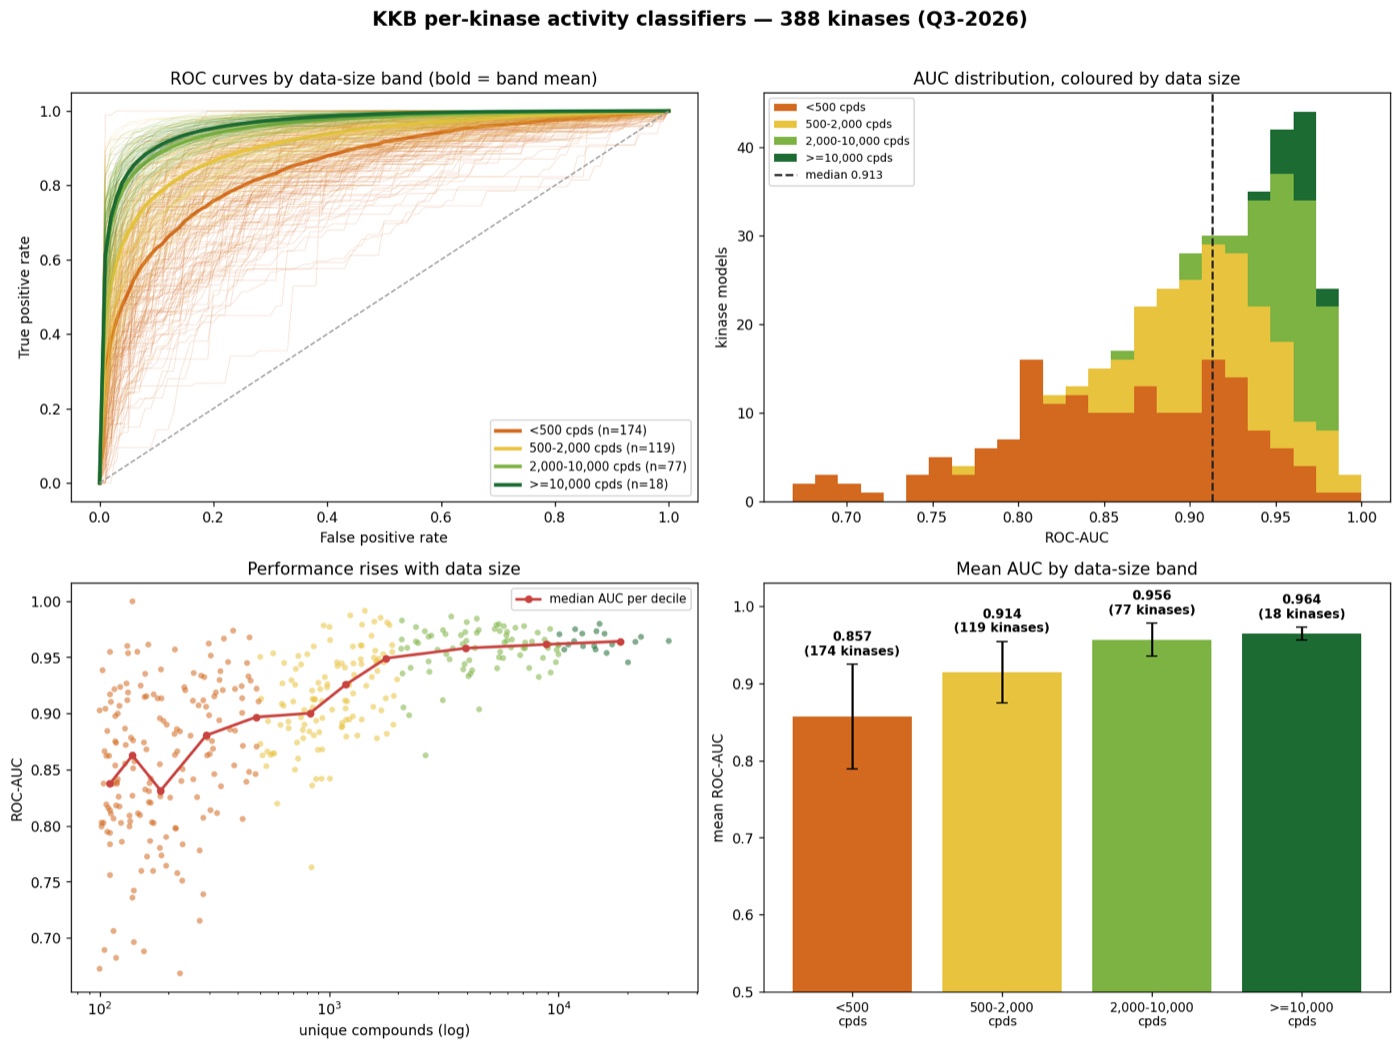
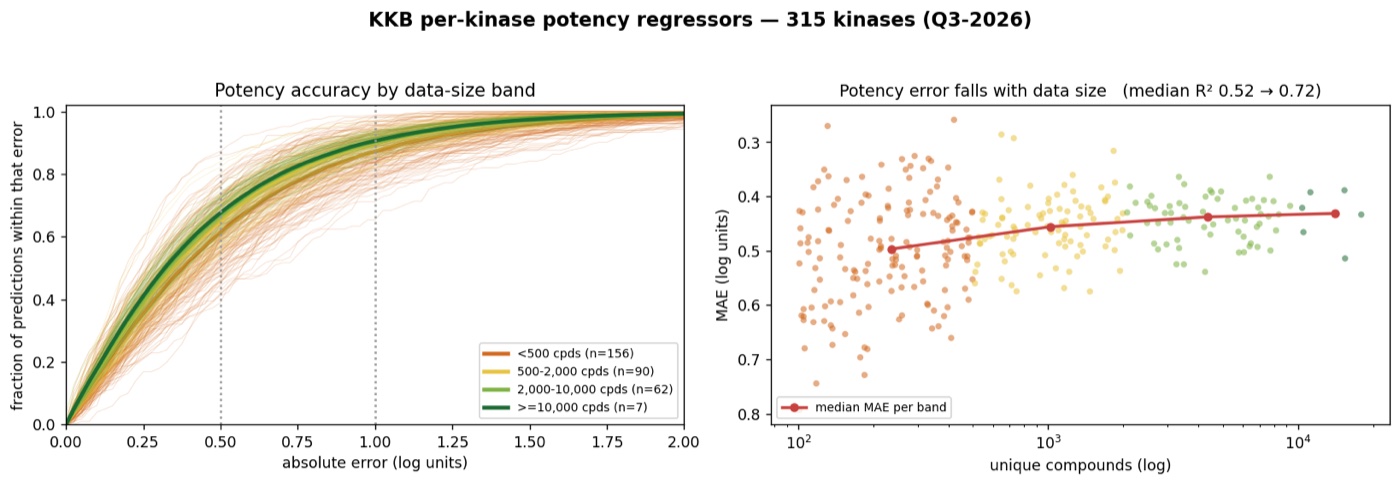
Per-kinase model performance across 390 kinases
Kinase Knowledgebase (KKB)
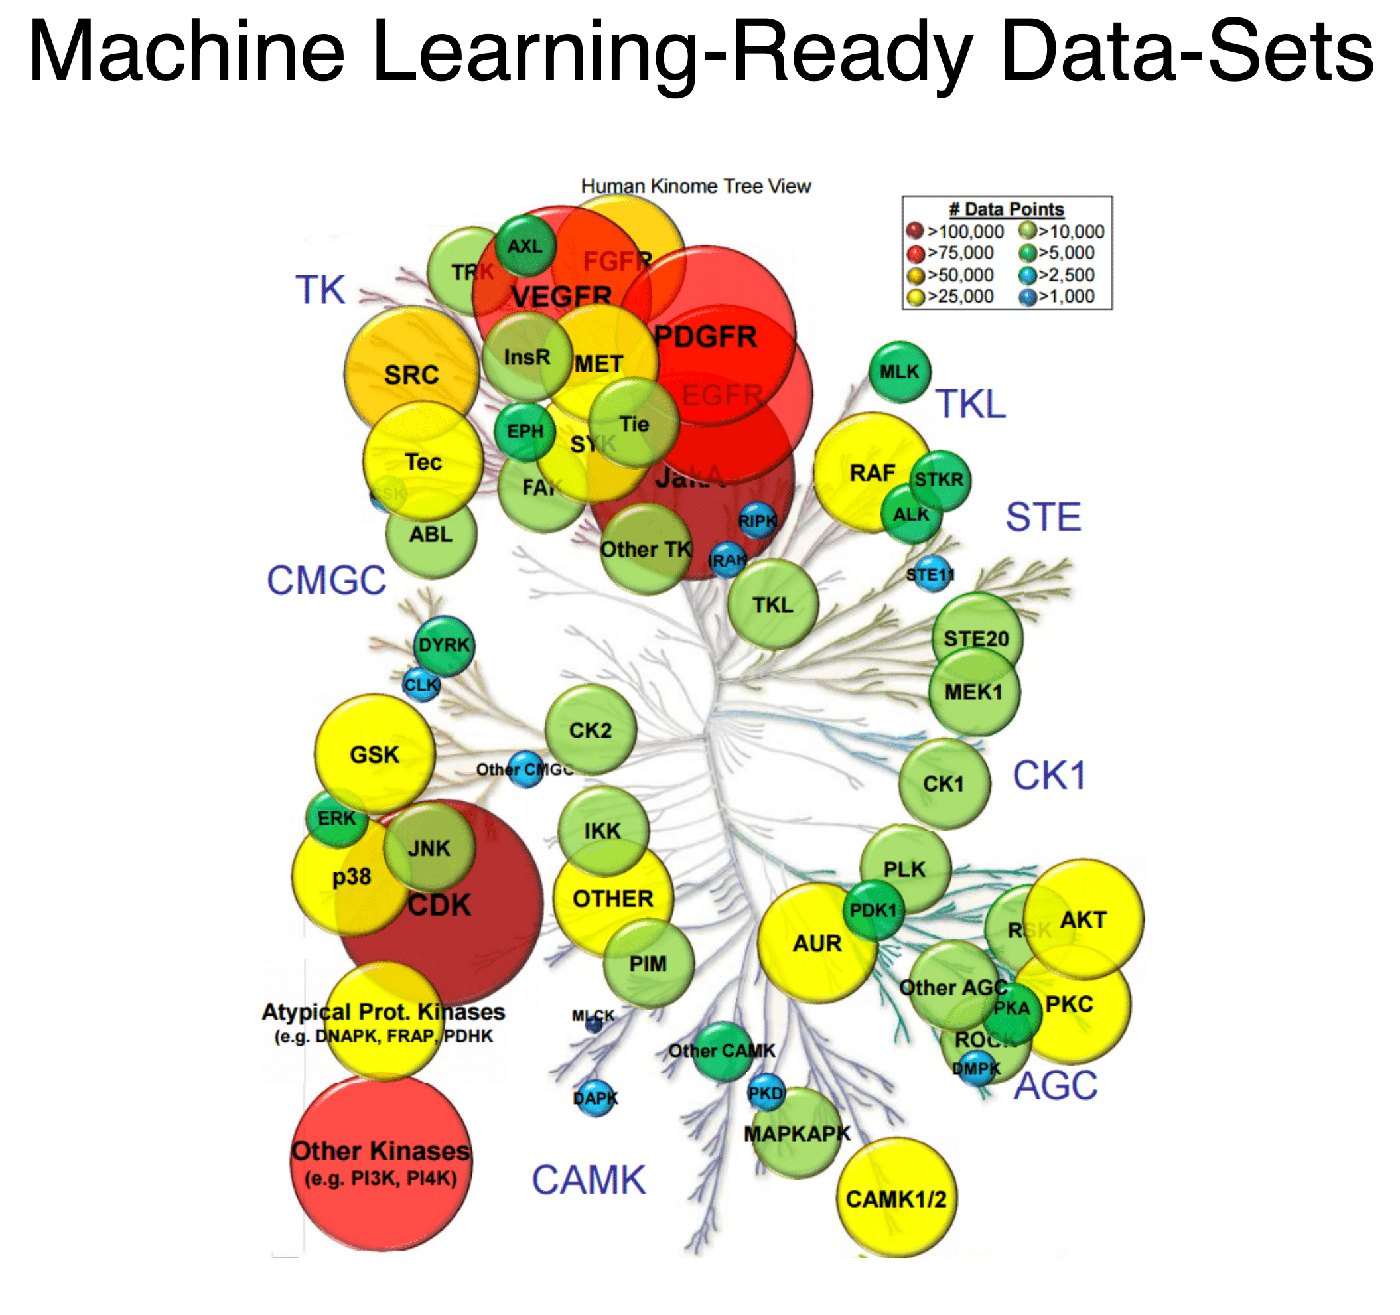
Currently the Kinase Knowledgebase Q3 2026 Release includes the following data:
- Journal articles and patents: 10,381
- Number of Biological Activity Data Points: 4,512,561
- Number of unique kinase molecules with annotated assay data: 515,092
- Number of all unique kinase molecules from patents and articles (with or without bio-activity data): 859,838
- Number of unique kinase targets with assay data: 587
- Number of annotated assay protocols: 109,065
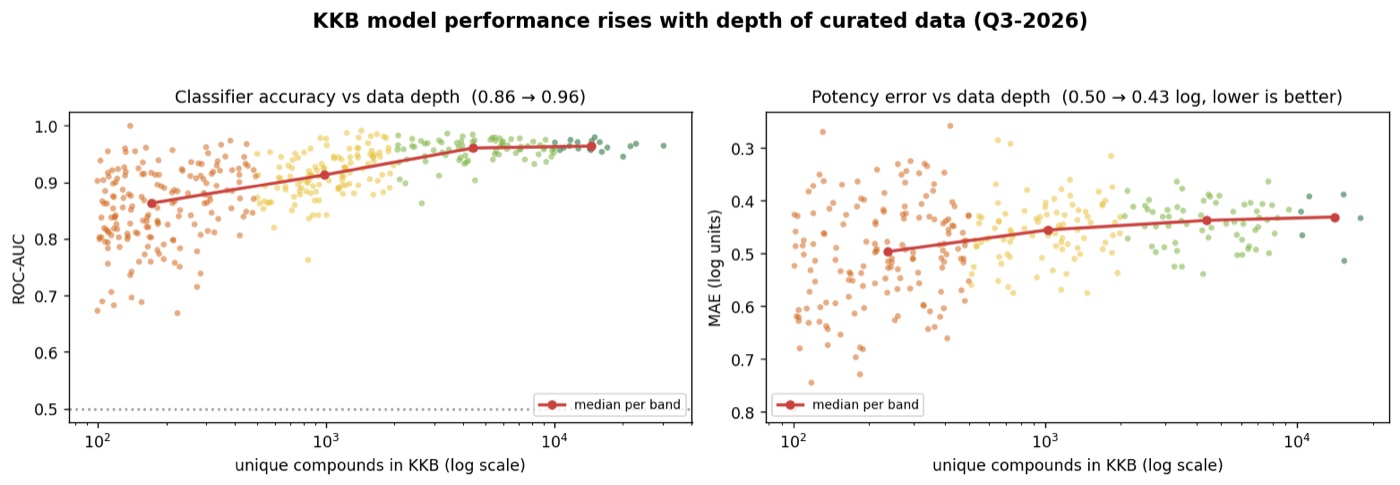
- Machine-learning models built from this release’s SAR: activity classifiers across 390 kinase targets, median ROC-AUC 0.91 (0.96 for well-studied kinases). View the model performance report
To show what this depth of curation supports, we build machine-learning models from the KKB SAR and report how they perform: an activity classifier for each of 390 kinase targets and a potency regressor for 316 of them. The panel at left summarizes classifier accuracy: ROC curves grouped by how much data each kinase has, the spread of ROC-AUC, and how accuracy rises with the depth of measured chemistry.
Accuracy is highest for compounds chemically related to what a target already has in KKB and declines for novel scaffolds, so every prediction is reported with a similarity score against the model’s own training set. Performance is also measured against published data absent from the knowledgebase.
Search the Kinase Knowledgebase →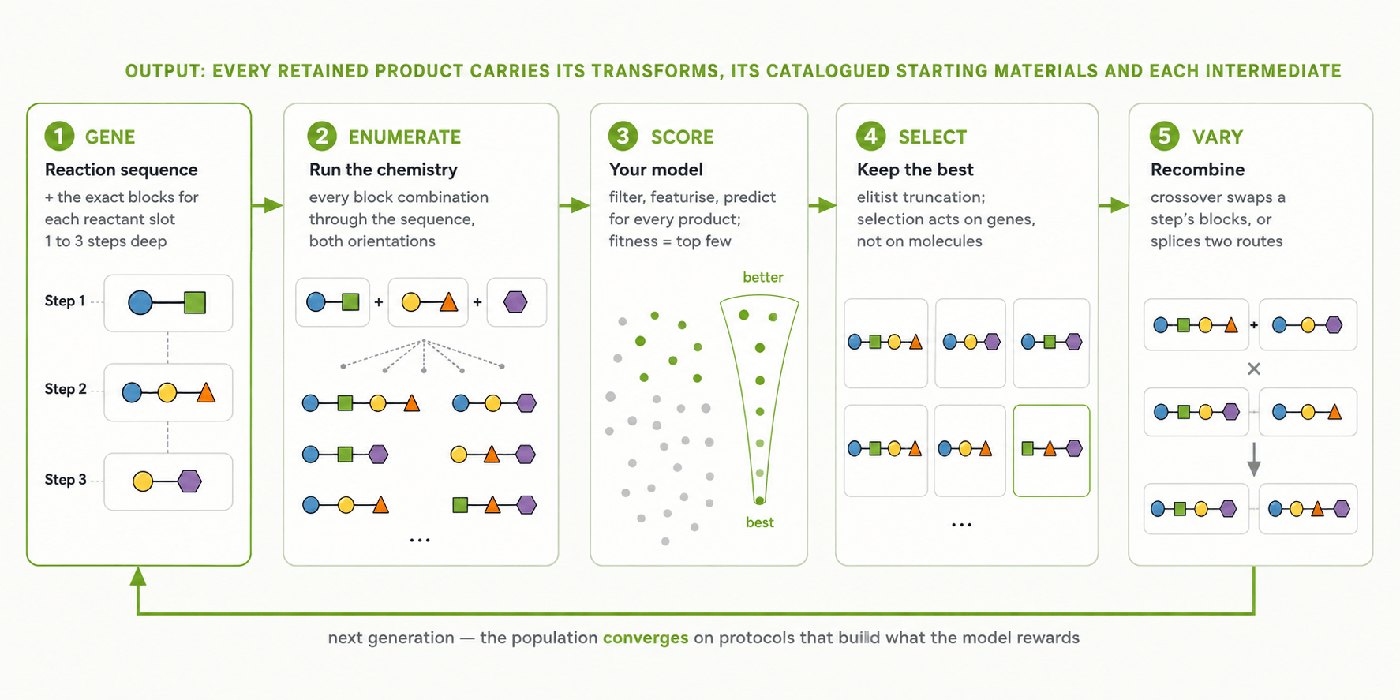
How the search works. Click the diagram for the full method.
ChIP™ de Novo Design
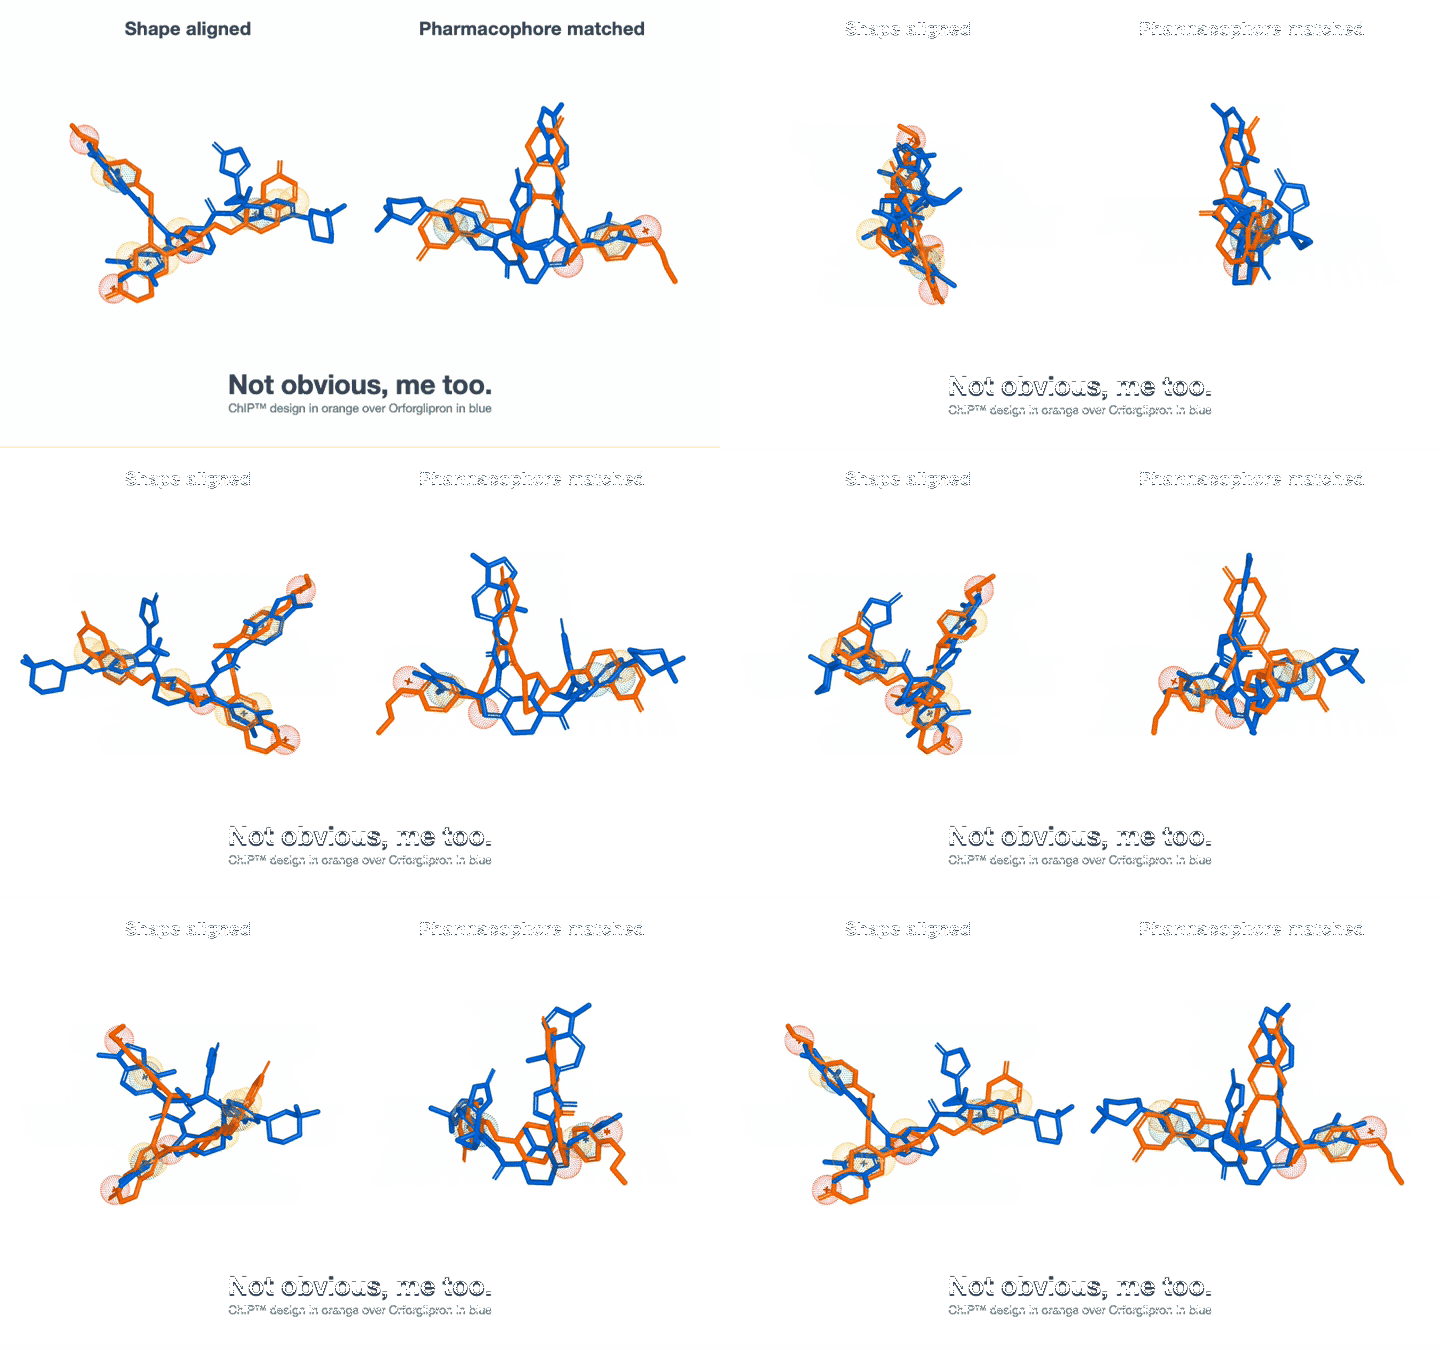
Design molecules you can actually make. ChIP searches reaction space, not molecule space: it evolves synthetic protocols (a sequence of validated reactions plus the specific cataloged building blocks entering each one) and scores the molecules those protocols produce with your predictive model. Every design that comes out carries an executable synthesis from purchasable starting materials.
85 validated reaction transforms drawing on 853,409 cataloged building blocks, across 154 reactant slots. Potency, selectivity, an ADME or physicochemical property: any per-molecule model can drive the search, and every campaign is paired with a matched random control.
How ChIP works → Random forest potency example → Non-obvious me too example →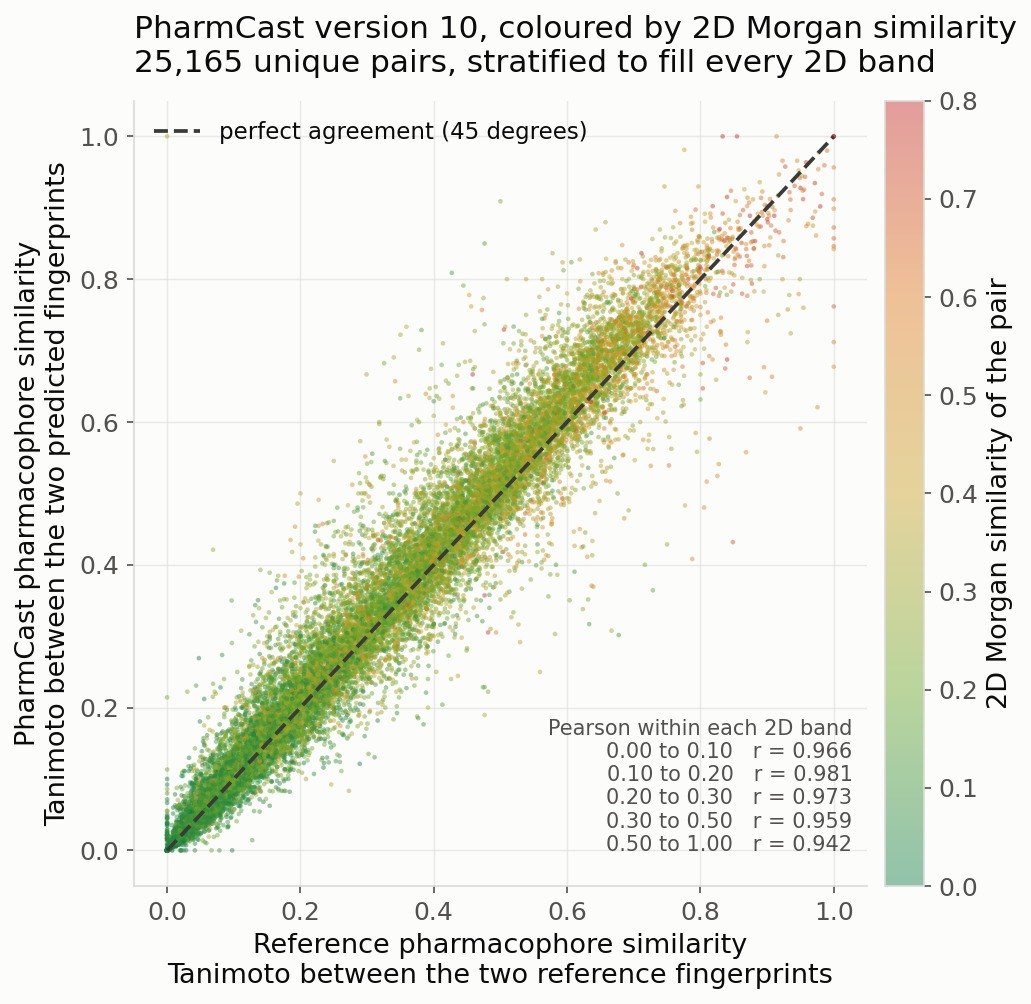
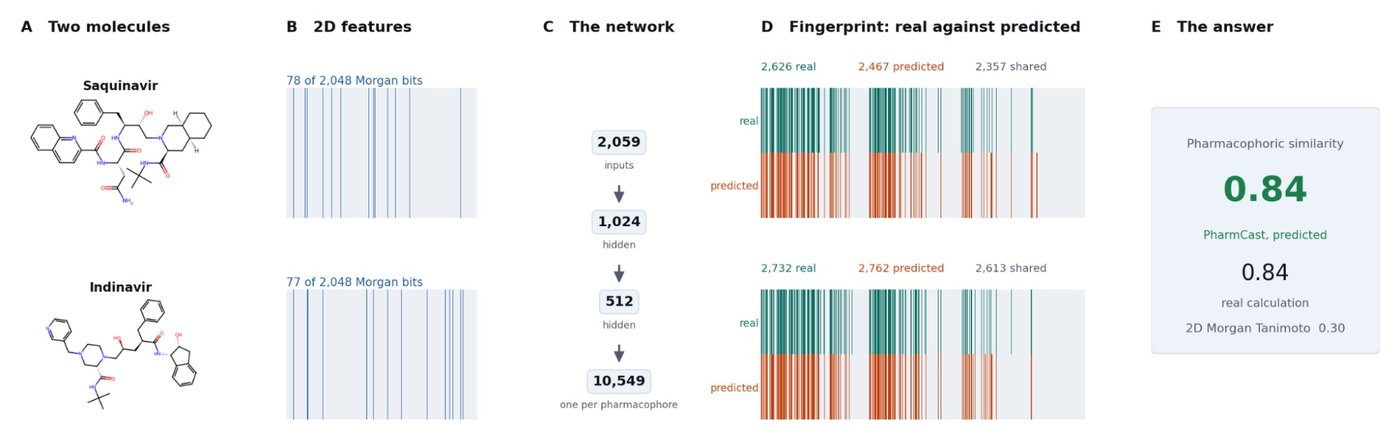
Predicted against reference pharmacophore similarity, colored by 2D similarity, PharmCast version 10
Turbocharged Pharmacophoric SimilarityNew!
Compare, rank and cluster molecules by the three-dimensional features they present, from flat structure alone. The comparison is made on our pharmacophoric fingerprints, the 10,549-bit three-point PolyPharmPrint™ encoding; what is new is how fast the answer arrives.
A full pharmacophoric comparison of two molecules takes 0.584 milliseconds against 5.71 seconds for the reference calculation, and agrees with it at Pearson 0.980. Ranking a reference against the whole 4.65 million compound screening collection takes 29.3 minutes, where the conventional route needs 3,697 core hours. In a retrieval test the true nearest neighbor is in the surrogate's top 100 for 89.3% of queries and its top 500 for 97.5%.
How it works → See the pipeline → Read the paper →Kinase Contact MapsNew!
What the ligand is actually doing, measured from the deposited coordinates: hydrogen bonds with a real donor to hydrogen to acceptor angle wherever the heavy atoms fix the hydrogen, halogen bonds, salt bridges, pi stacking, cation to pi and metal coordination. Every compound shown is the same molecule as a ligand in a Protein Data Bank kinase structure and has Kinase Knowledgebase activity against that same target; where the two records describe its 3D form with different precision, the figure says so. A different structure each time you load this page.
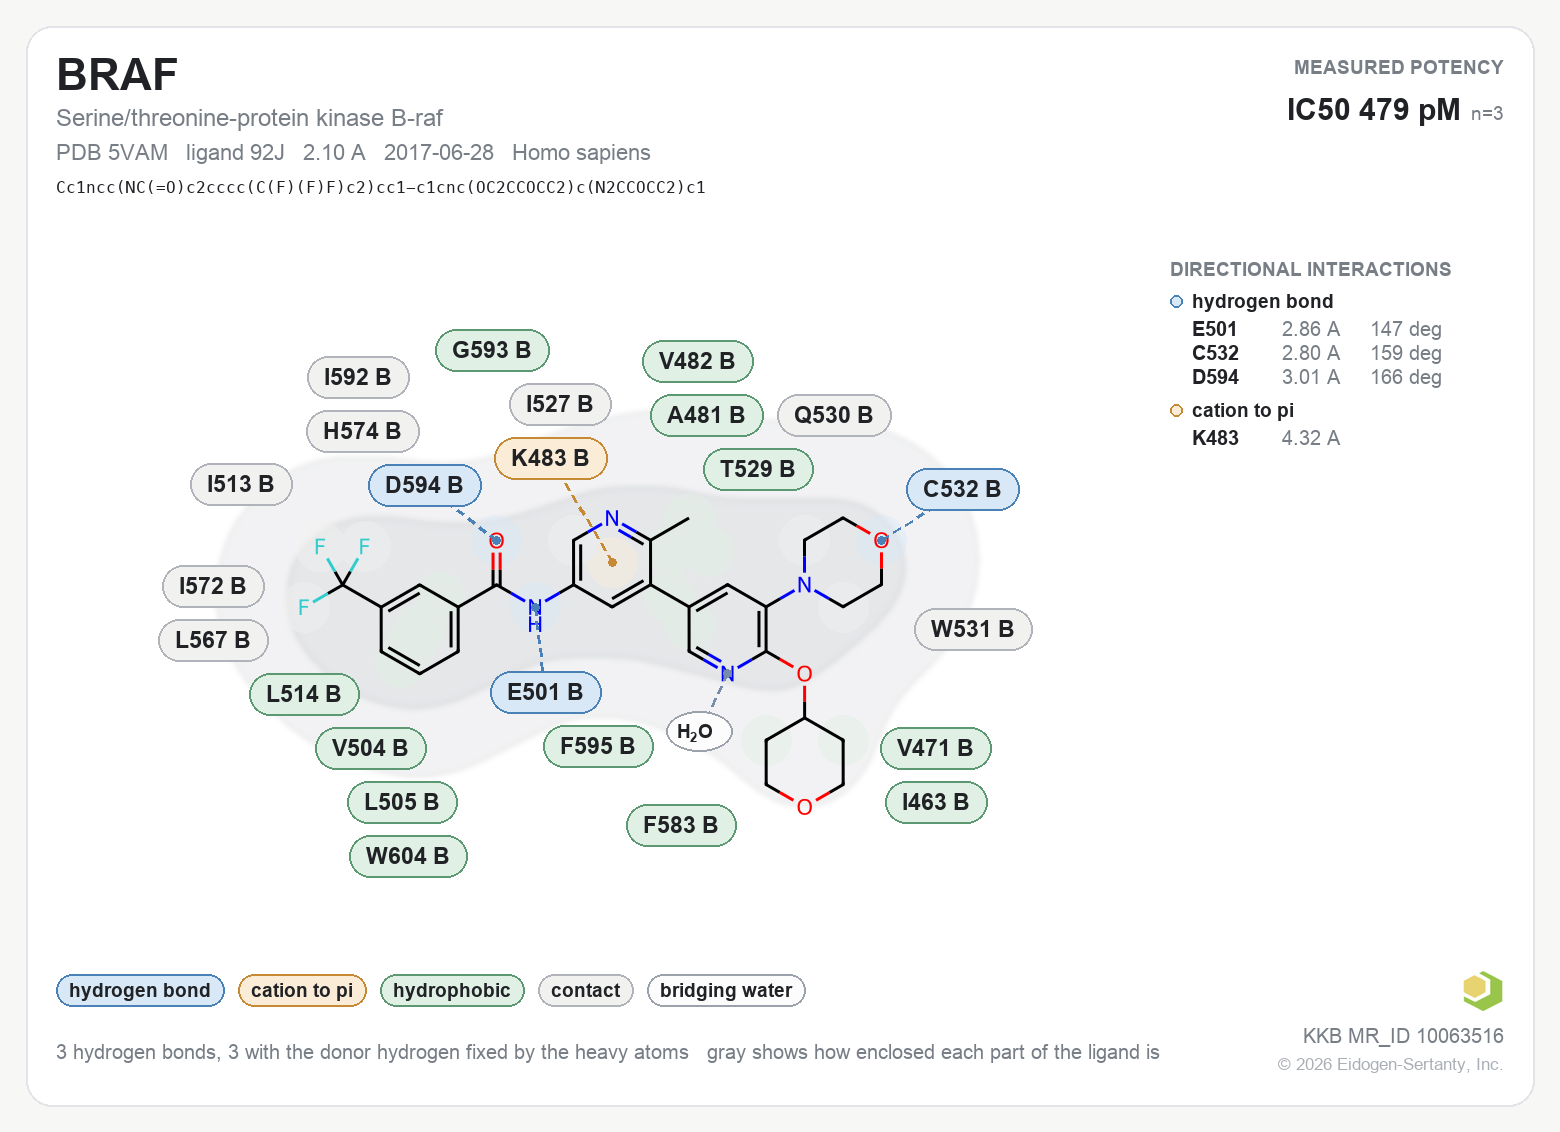
BRAF Serine/threonine-protein kinase B-raf · PDB 5VAM · ligand 92J · IC50 0.479 nM · 6 KKB SAR points against this target
How these are measured, with this structure →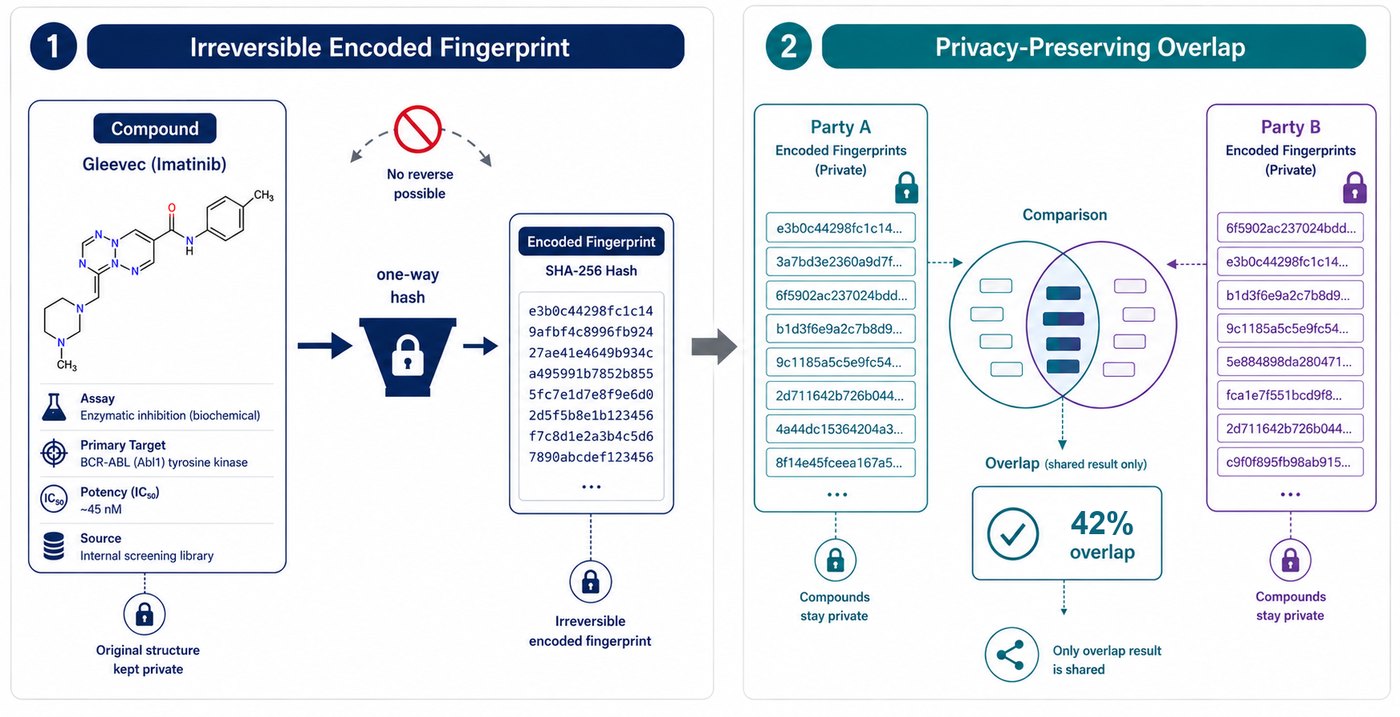
Illustrative example. Figures shown are for explanation only and are not results from our datasets.
Dataset Overlap AnalysisNew
How much of a dataset do you already have? Our toolkit answers that for any two SAR datasets, in any target family, without either side revealing a structure. Each party encodes its own data locally into irreversible SHA-256 fingerprints; only fingerprints are compared, and only the overlap figure is shared.
How it works → Download the toolkit →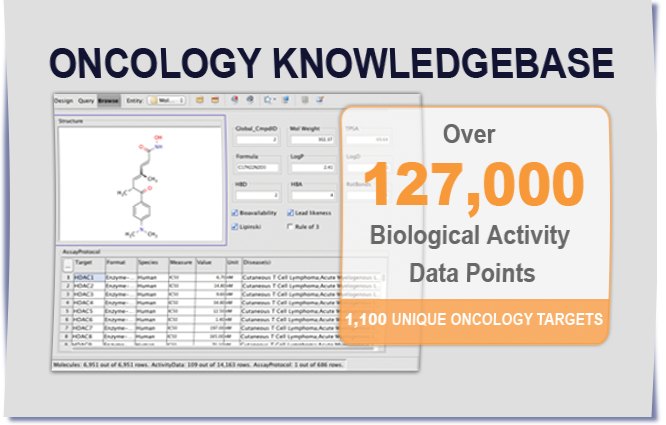
Oncology Knowledgebase (OKB)
Currently the Oncology Knowledgebase Q2 2023 Release includes the following data:
- Journal articles and patents: 977
- Number of Biological Activity Data Points: 146,206
- Number of molecules from patents and articles: 66,198
- Number of unique oncology targets with assay data: 1,158
- Number of annotated assay protocols: 5,614
- Number of disease models: 137

Food Health (left) and Food Health TxD (right), on iPhone. Click the figure for the apps, demos and essays
Food Health TrackingNew
Drug discovery, data and software are most of what we do. Proactive wellness is the rest. Food Health is a mobile app for iPhone and Android that turns a meal into data: snap a photo or type a note, and it estimates calories, protein, carbs, fat and fiber in seconds, reads activity, sleep and workouts from Apple Health, and shows nutrition trends and scatter plots over time.
Spot the meals that spike you. Food Health TxD pairs the same carb estimation with continuous glucose readings on one timeline, and adds a menu scanner that picks the lowest-carb options. Built for type 1, type 2 and prediabetes. For education and tracking only: it is not a medical device.
Both keep data on the device by default. A photo leaves it only at scan time.